Configure Elastic Stack
For an overview of Elastic Stack and its components used with PLOSSYS 5, refer to Elastic Stack.
In Elasticsearch, different indices are used for log messages, for statistics messages and for audit messages of PLOSSYS 5.
Configure the Housekeeping of the Messages (Index Lifecycle Management, ILM)
For the messages, you can configure the housekeeping in Elasticsearch via the Kibana user interface (Index Lifecycle Management). Previously, Elasticsearch Curator has been used for the housekeeping of the messages in Elasticsearch. This is no longer required.
-
Stop the
seal-filebeatservices on all PLOSSYS 5 servers (if already installed) so that no new messages will be sent to Elasticsearch:plossys service stop seal-filebeat -
Open the Kibana user interface:
http://<admin_server>:5601 -
Delete the old indices due to these were created by
seal-filebeatby default: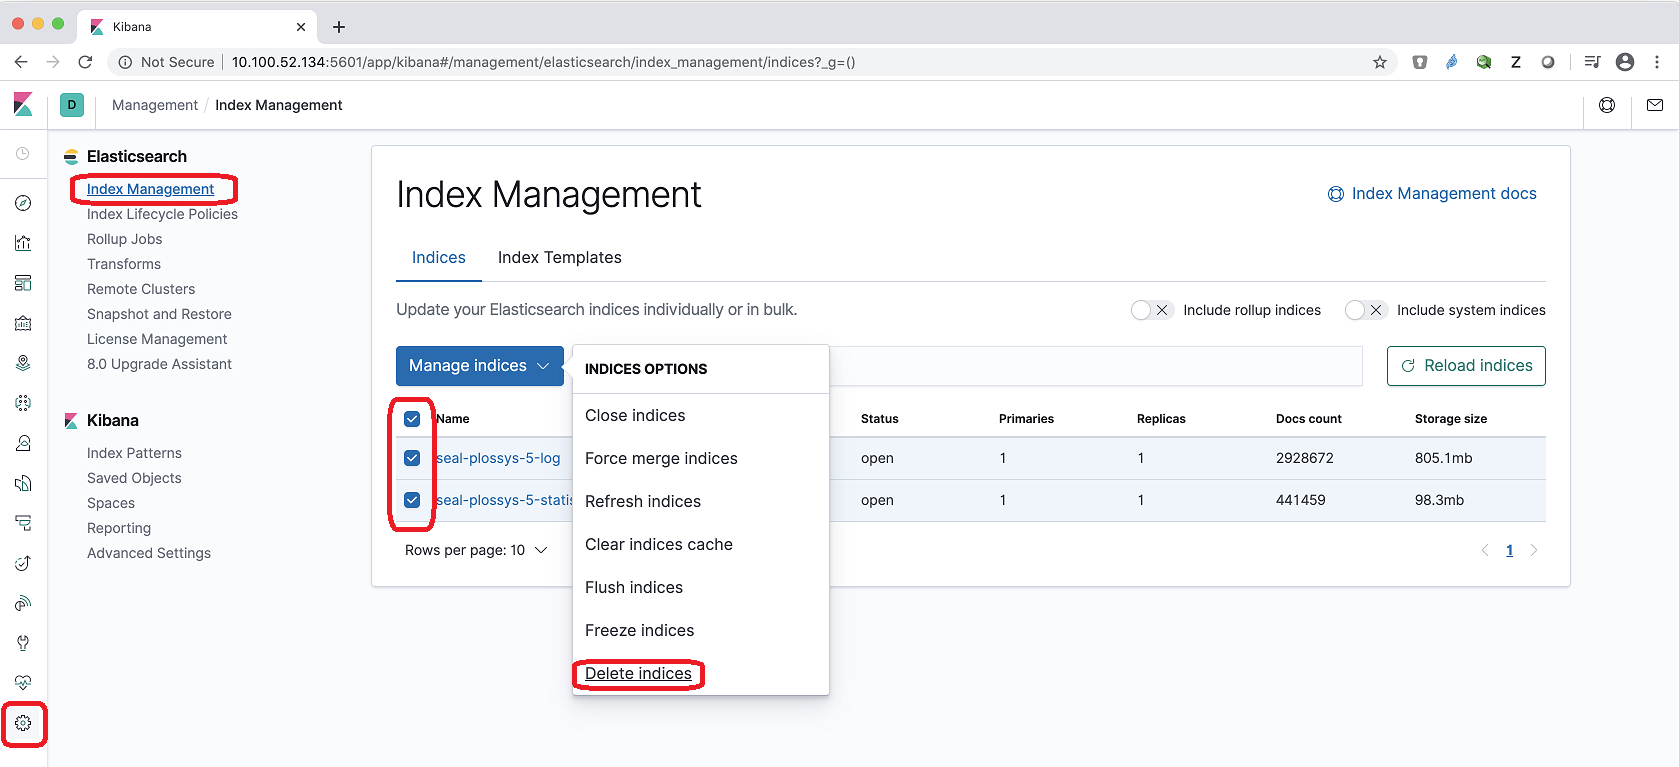
-
Create index lifecycle policies for the desired indices (
seal-plossys-5-log,seal-plossys-5-statistics,seal-plossys-5-audit) and specify the following settings: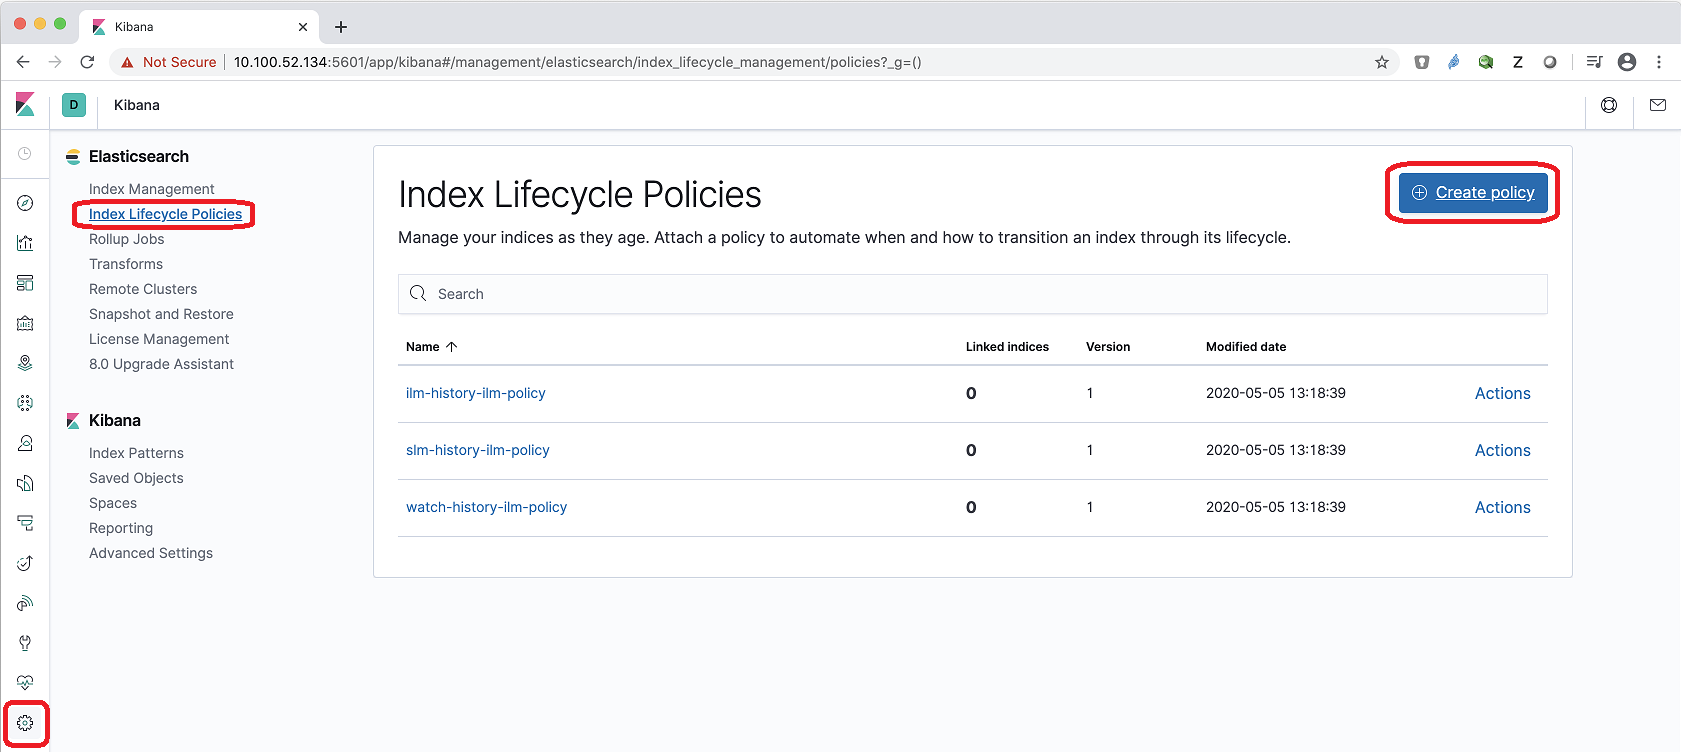
-
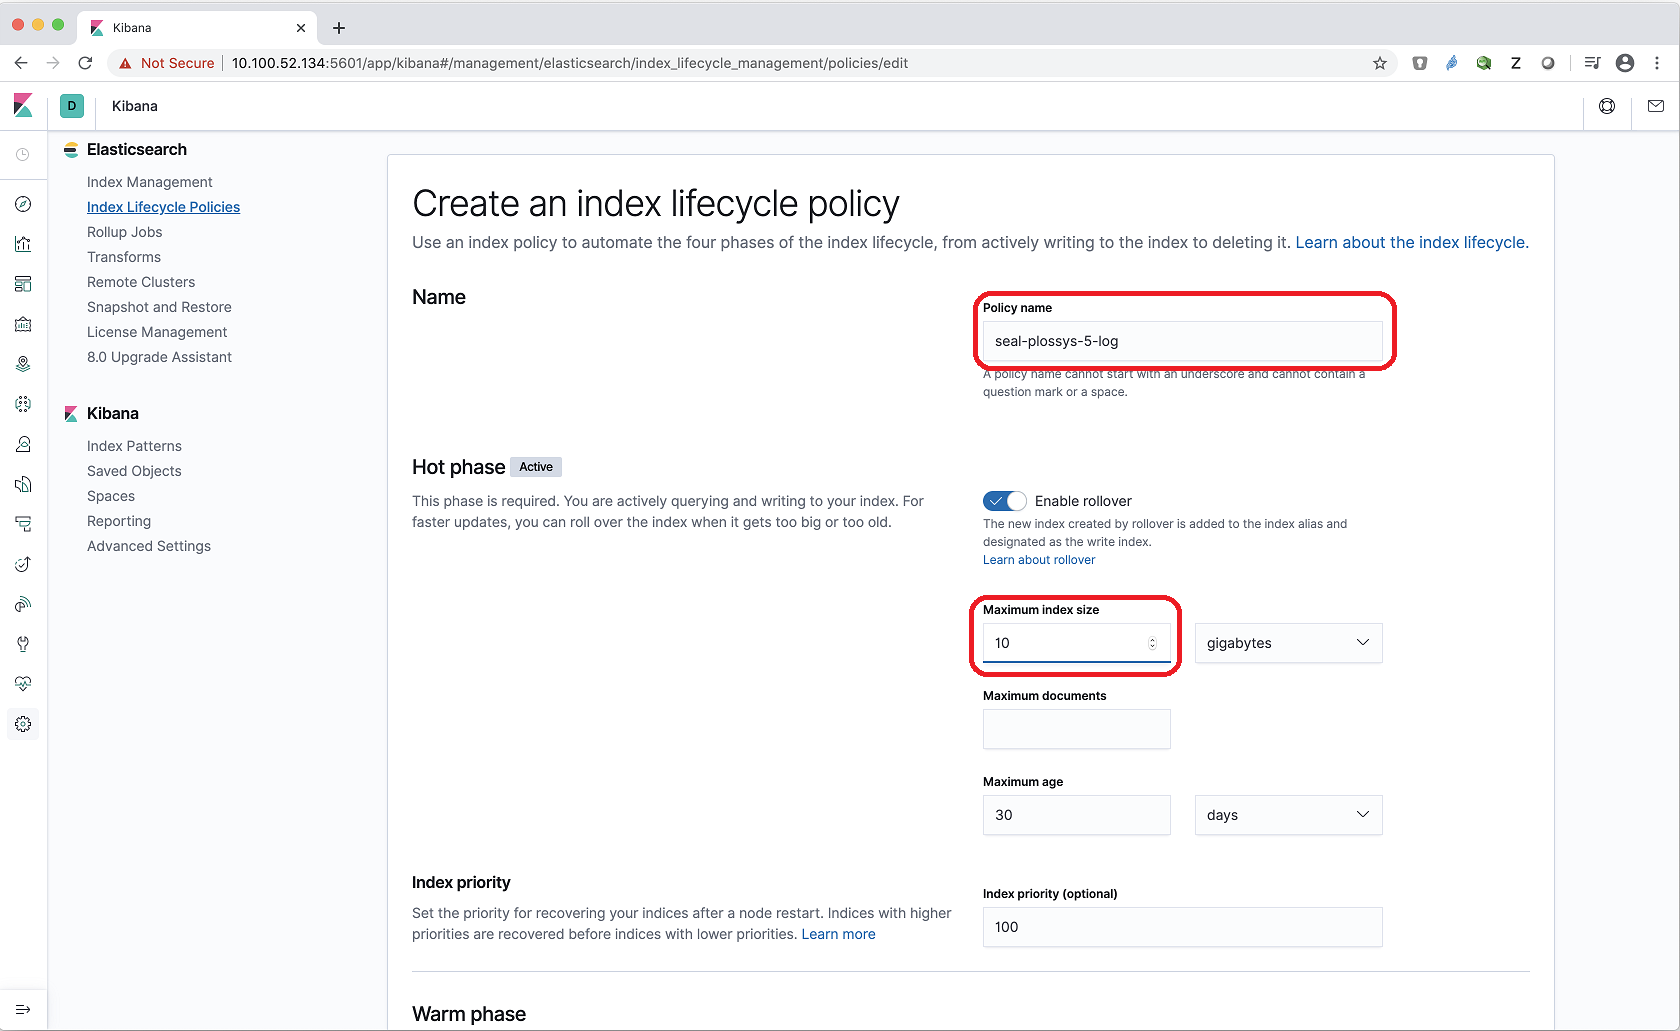
In the
Namesection, specifyPolicy name. Although the policy name is arbitrary, we recommend using the same name as for the index (seal-plossys-5-log). -
In the
Hot phasesection, specifyMaximum index size. We recommend 10 GB.
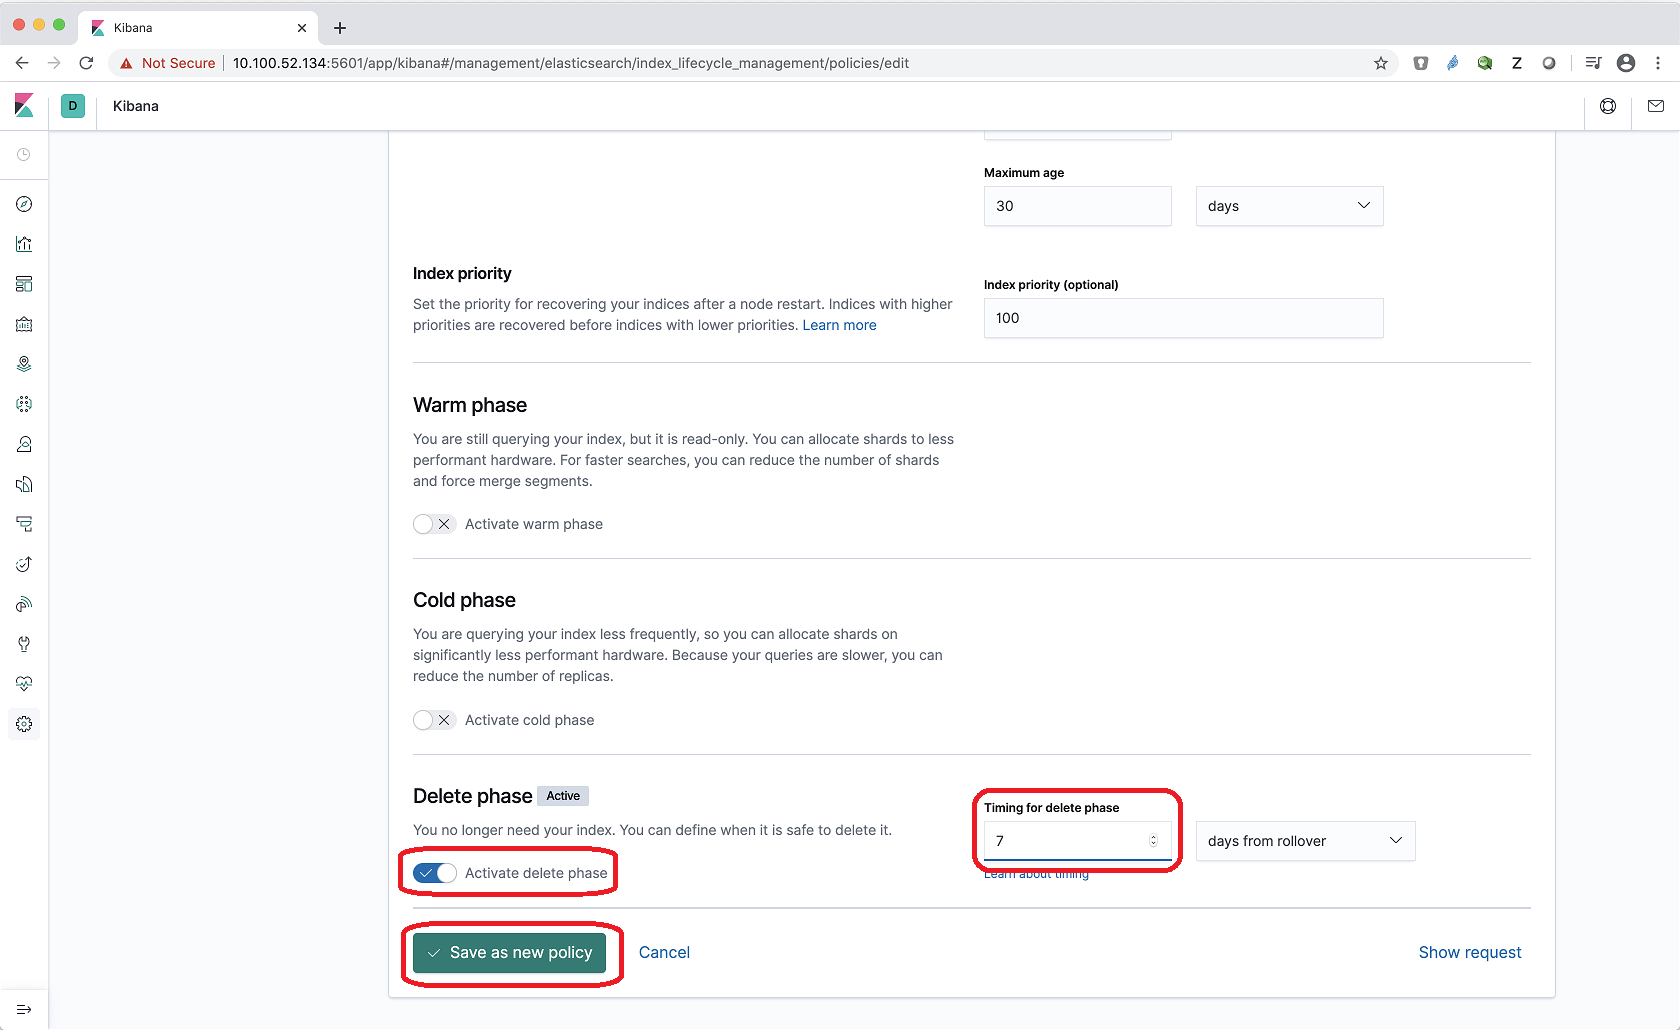
- Switch on
Activate delete phase, and then specifyTiming for delete phasein the activated section. We recommend 7 days.
Repeat the steps for
seal-plossys-5-statisticsandseal-plossys-5-auditcorrespondingly if desired. -
-
Create index templates for the indices and specify the following settings:
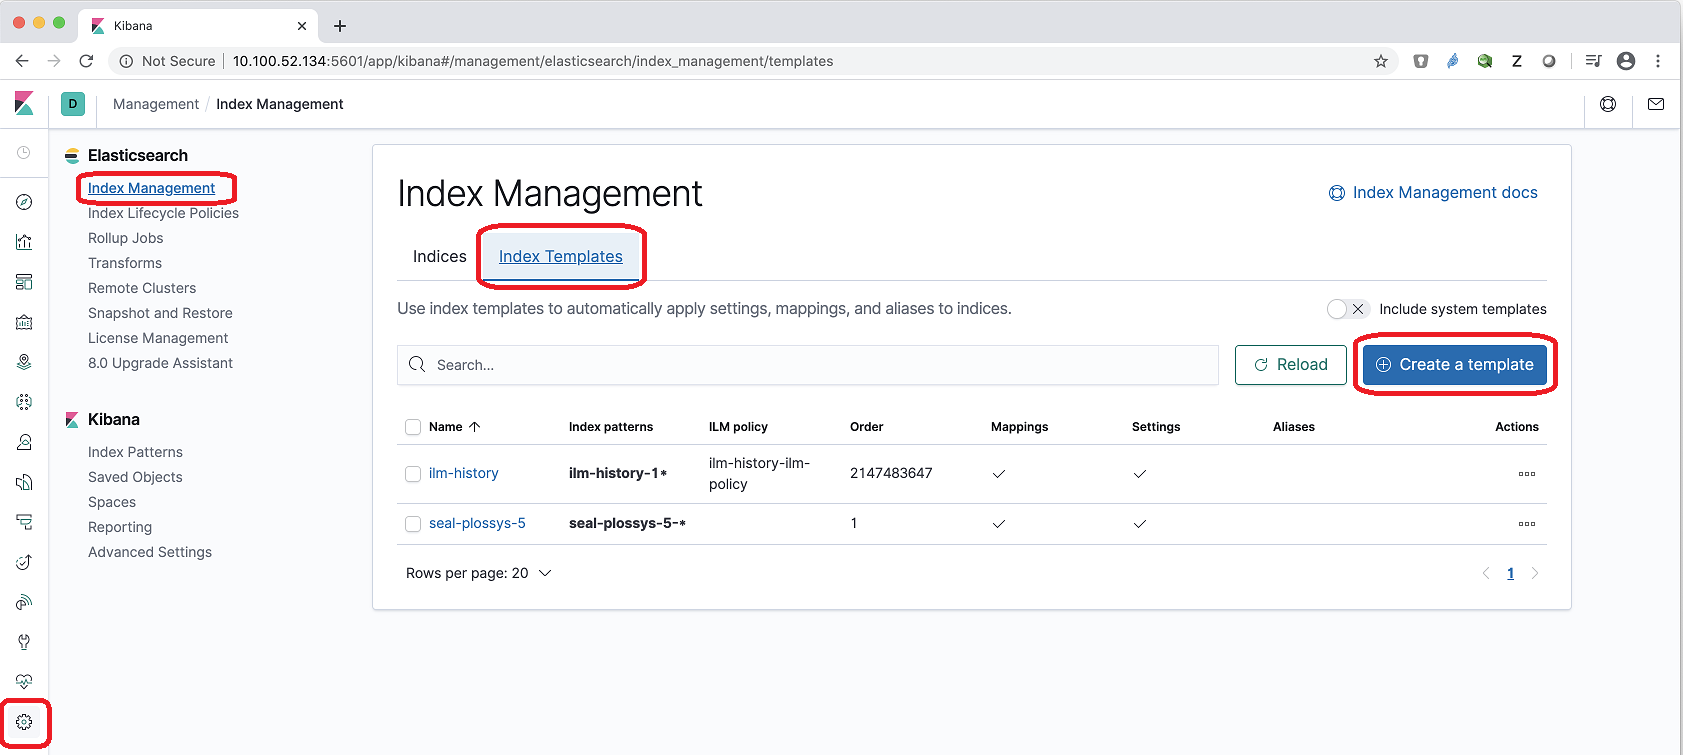
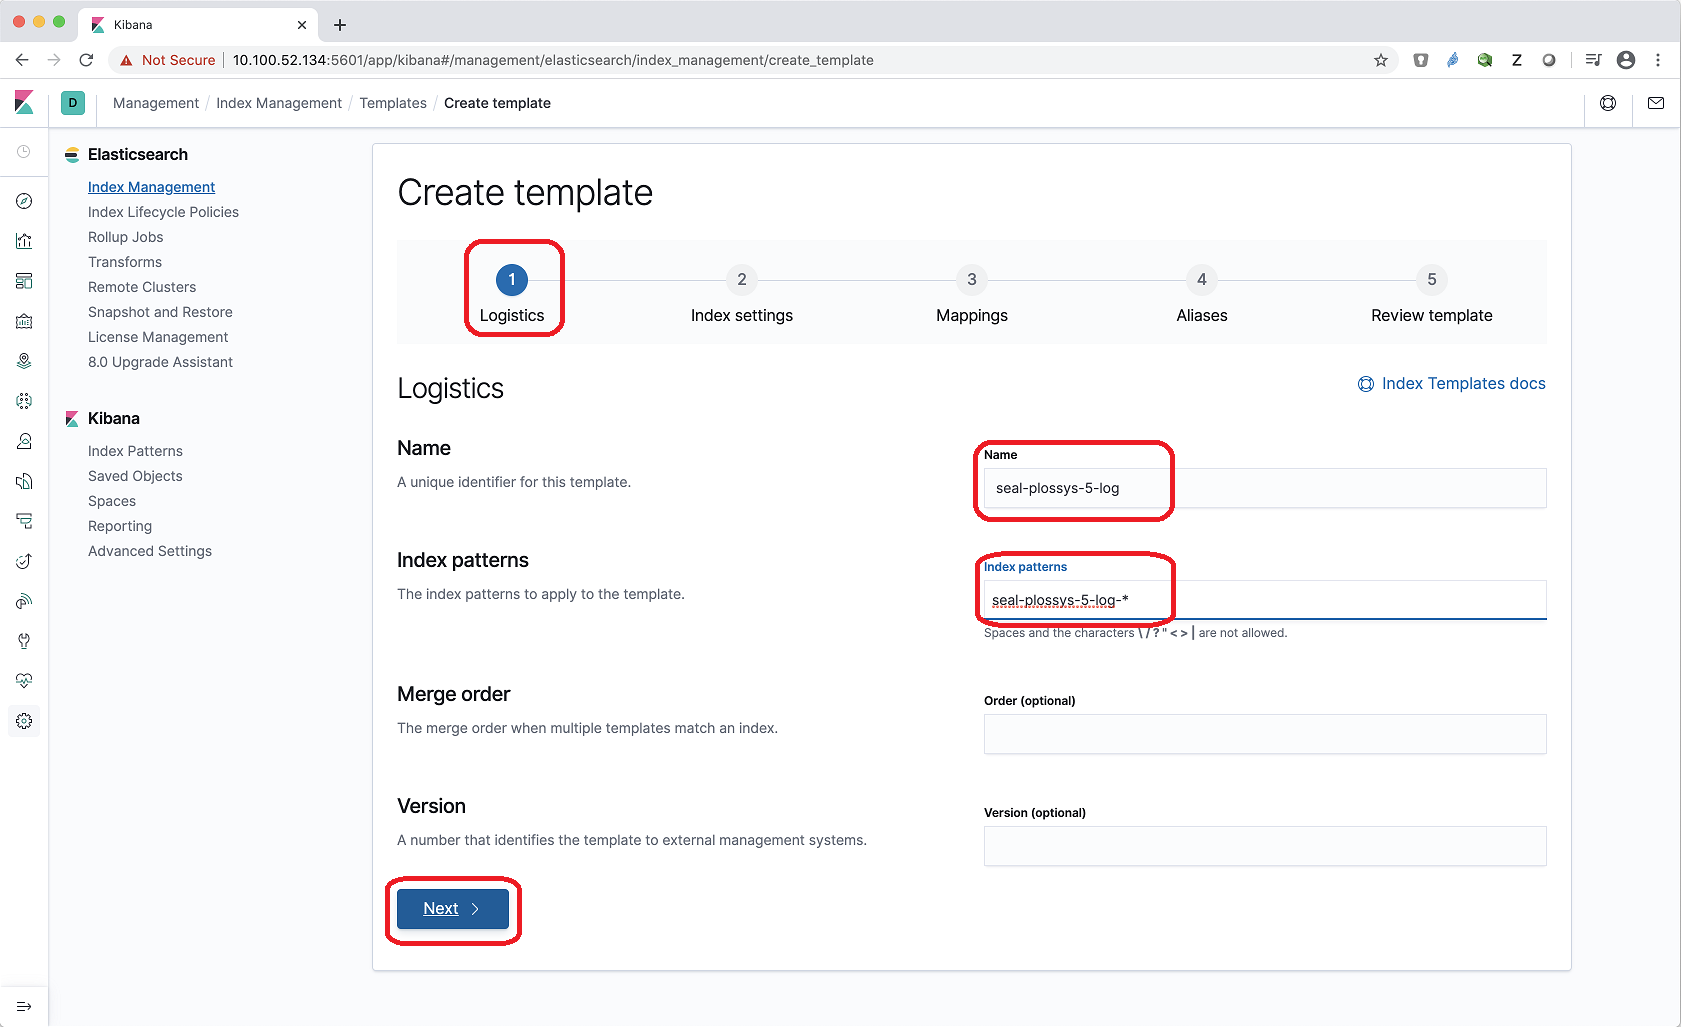
-
In the
Logisticstab, specifyName. We recommend using the same name as for the index (seal-plossys-5-log). -
In
Index patterns, specify the name of the index followed by-*(seal-plossys-5-log-*).
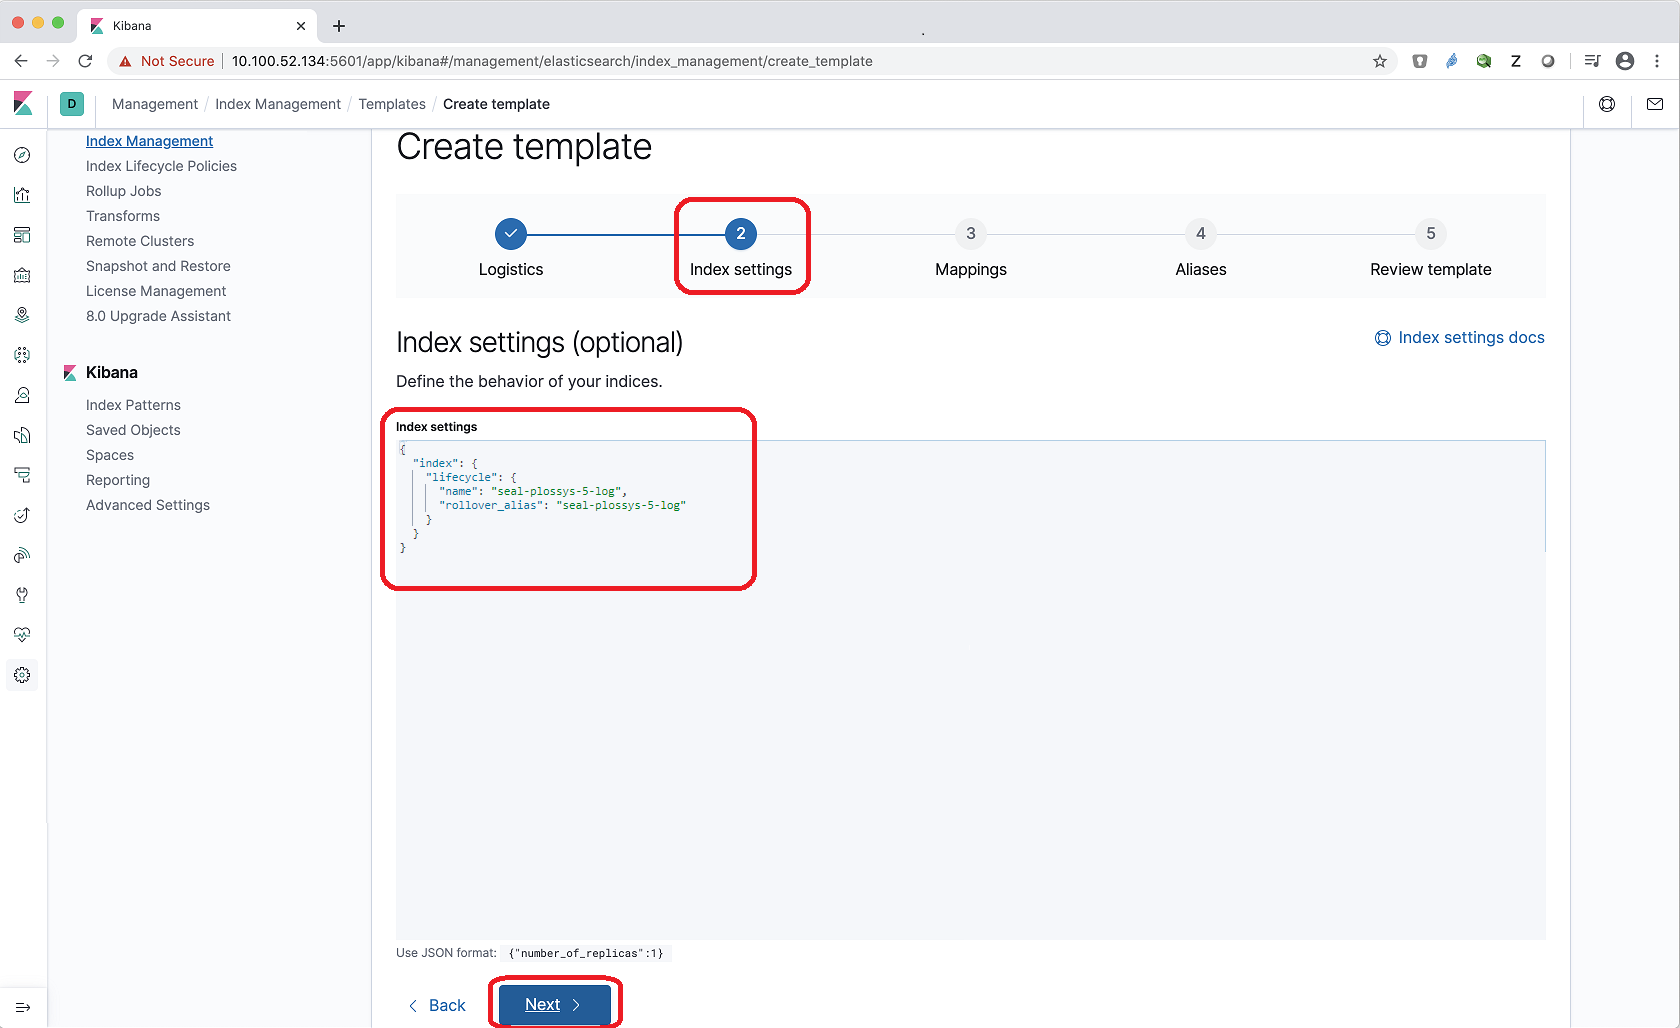
-
In the
Index settingstab, enter the following JSON object:{ "index": { "lifecycle": { "name": "seal-plossys-5-log", "rollover_alias": "seal-plossys-5-log" } } }
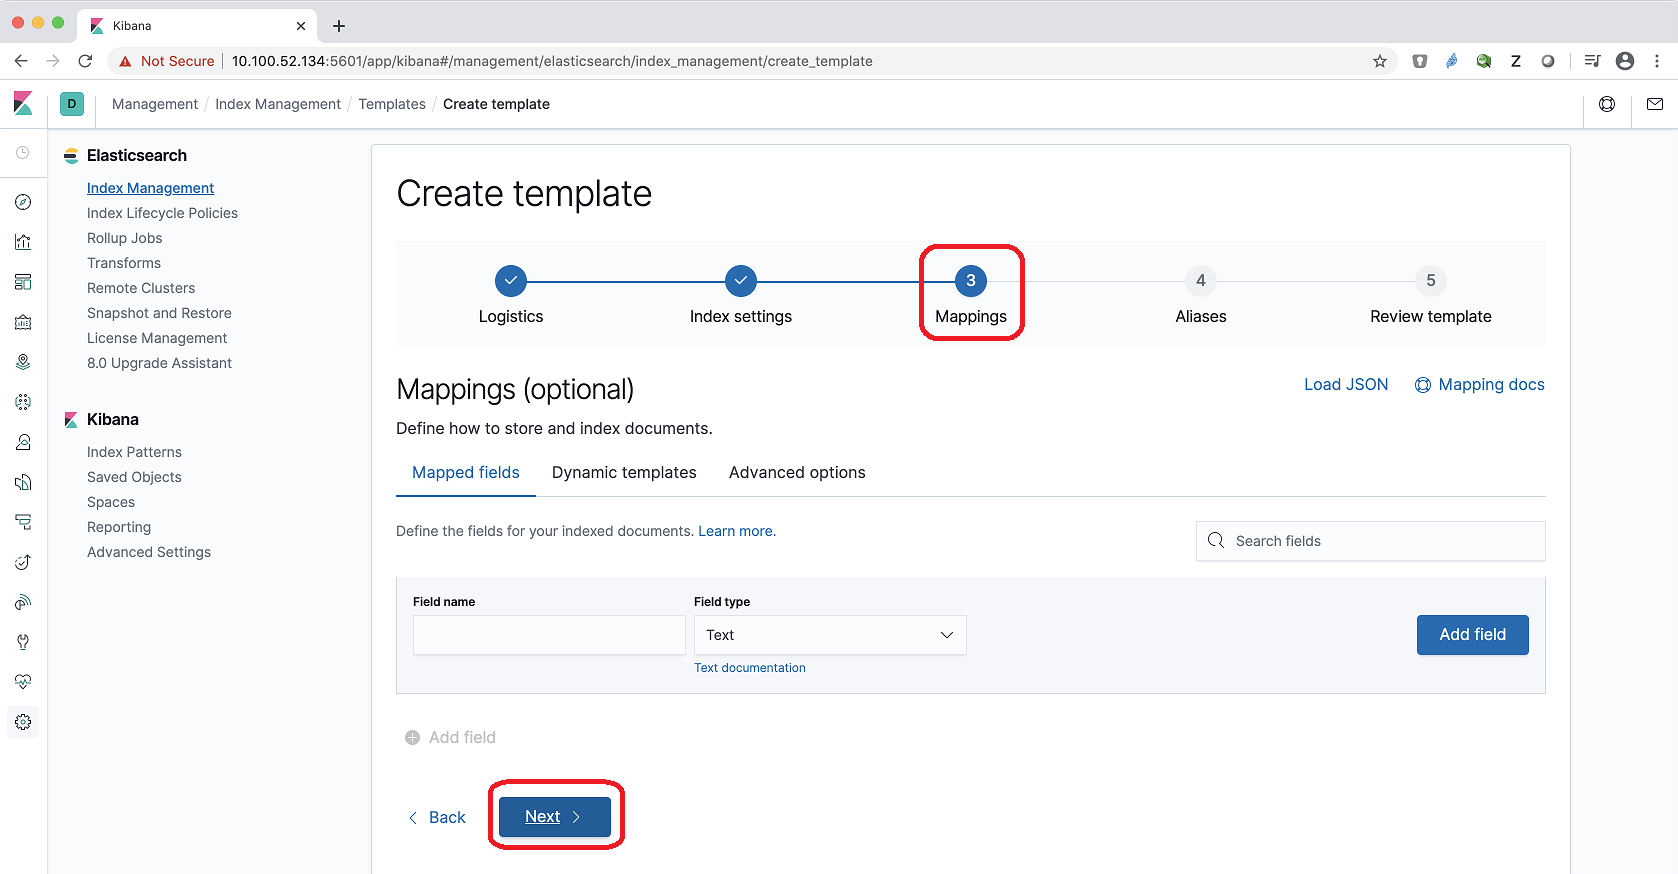
- In the
Mappingstab, nothing has to be specified:
- In the
Aliasestab, nothing has to be specified:
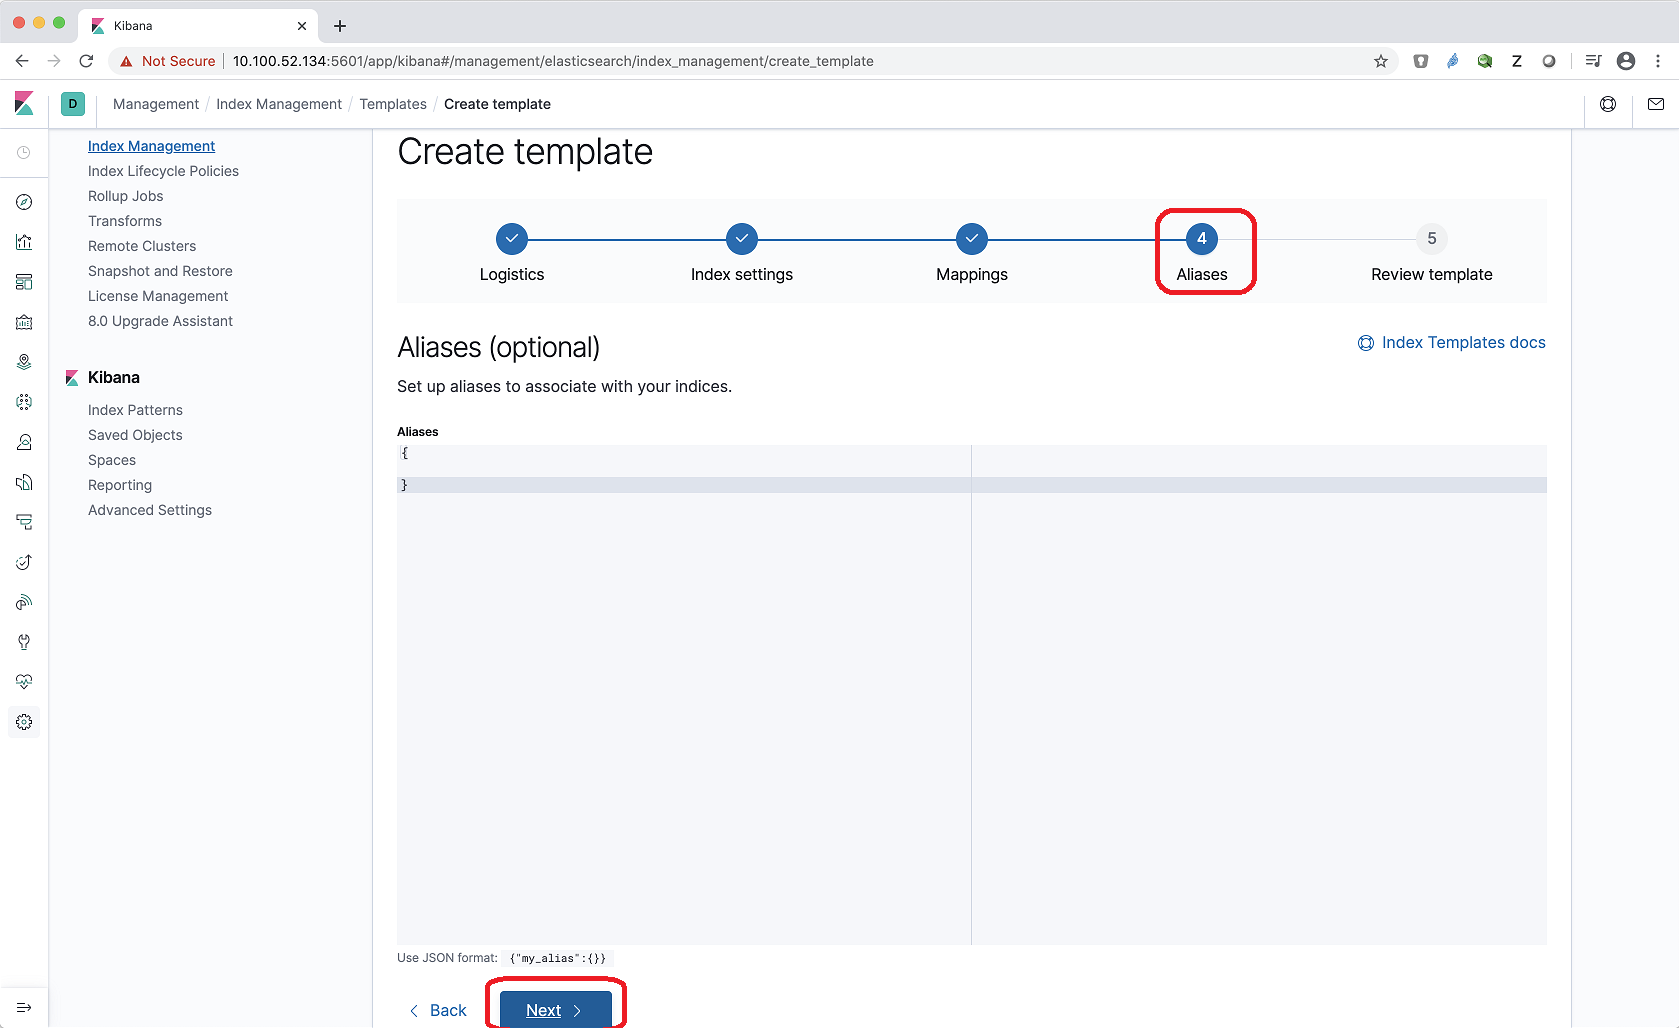
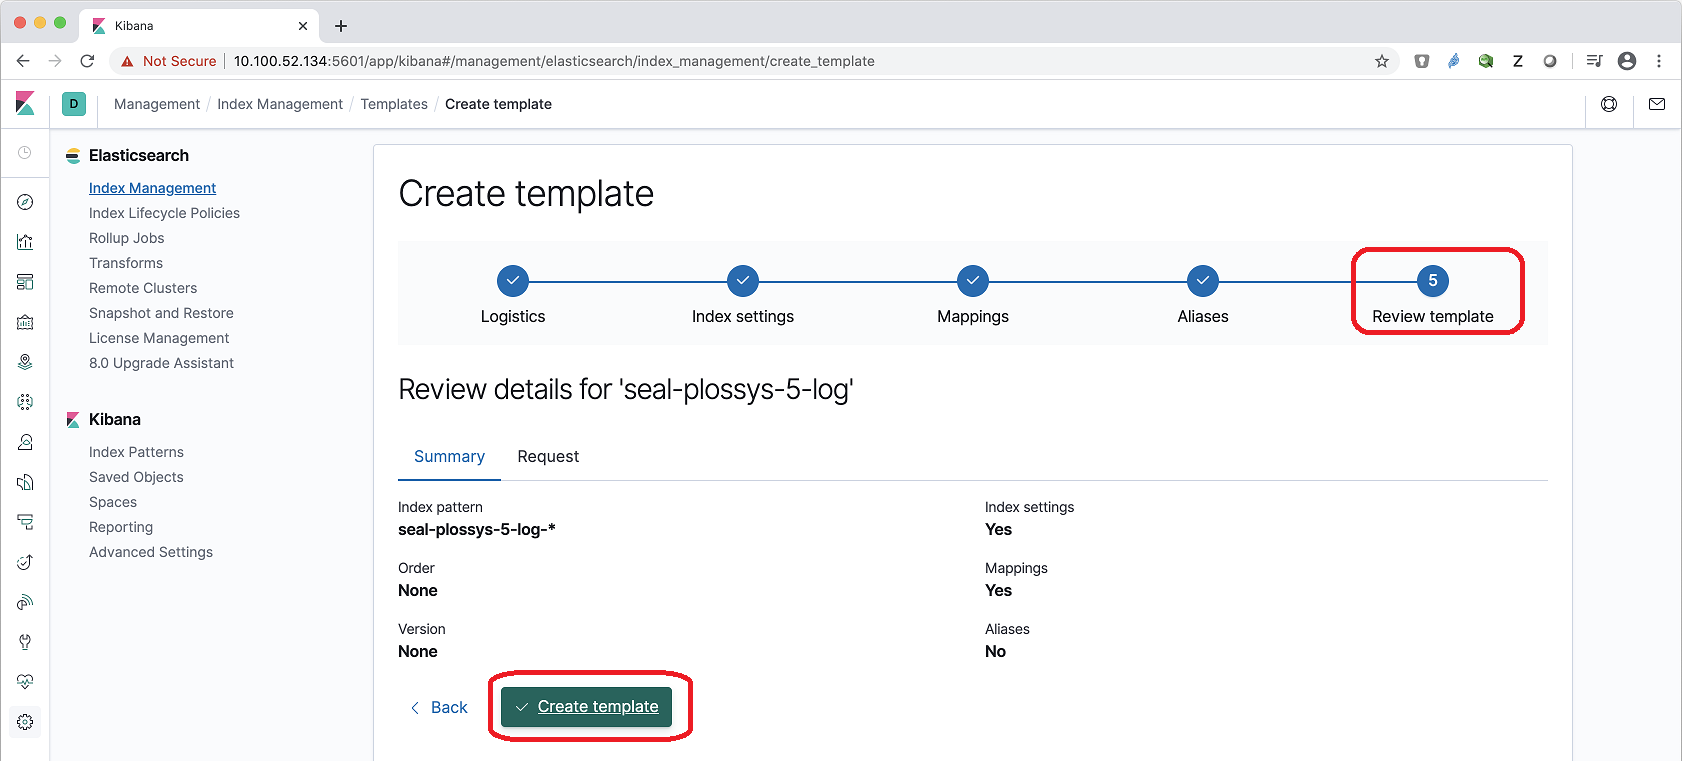
- Click
Create template.
Repeat the steps for
seal-plossys-5-statisticsandseal-plossys-5-auditcorrespondingly if desired. -
-
Create write aliases for the indices:
-
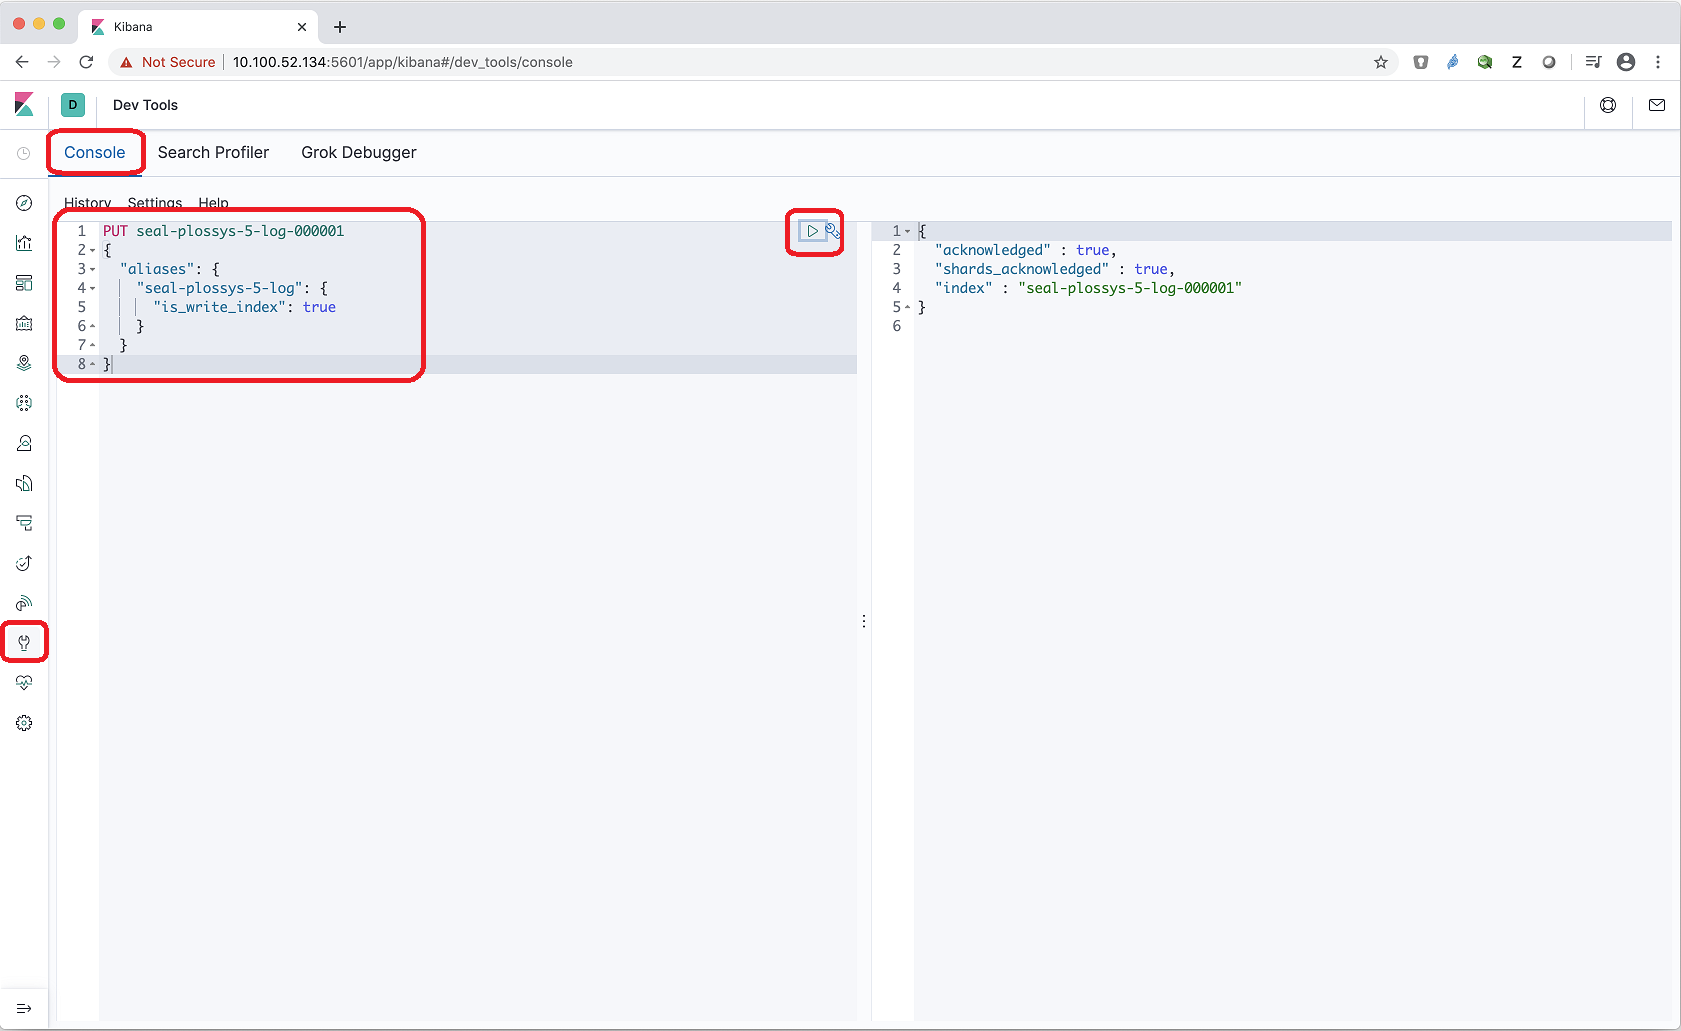
In the
Consoletab, enter the following code in the left column and click the arrow button afterwards:PUT seal-plossys-5-log-000001 { "aliases": { "seal-plossys-5-log": { "is_write_index": true } } }
Repeat the step for
seal-plossys-5-statisticsandseal-plossys-5-auditcorrespondingly if desired. -
-
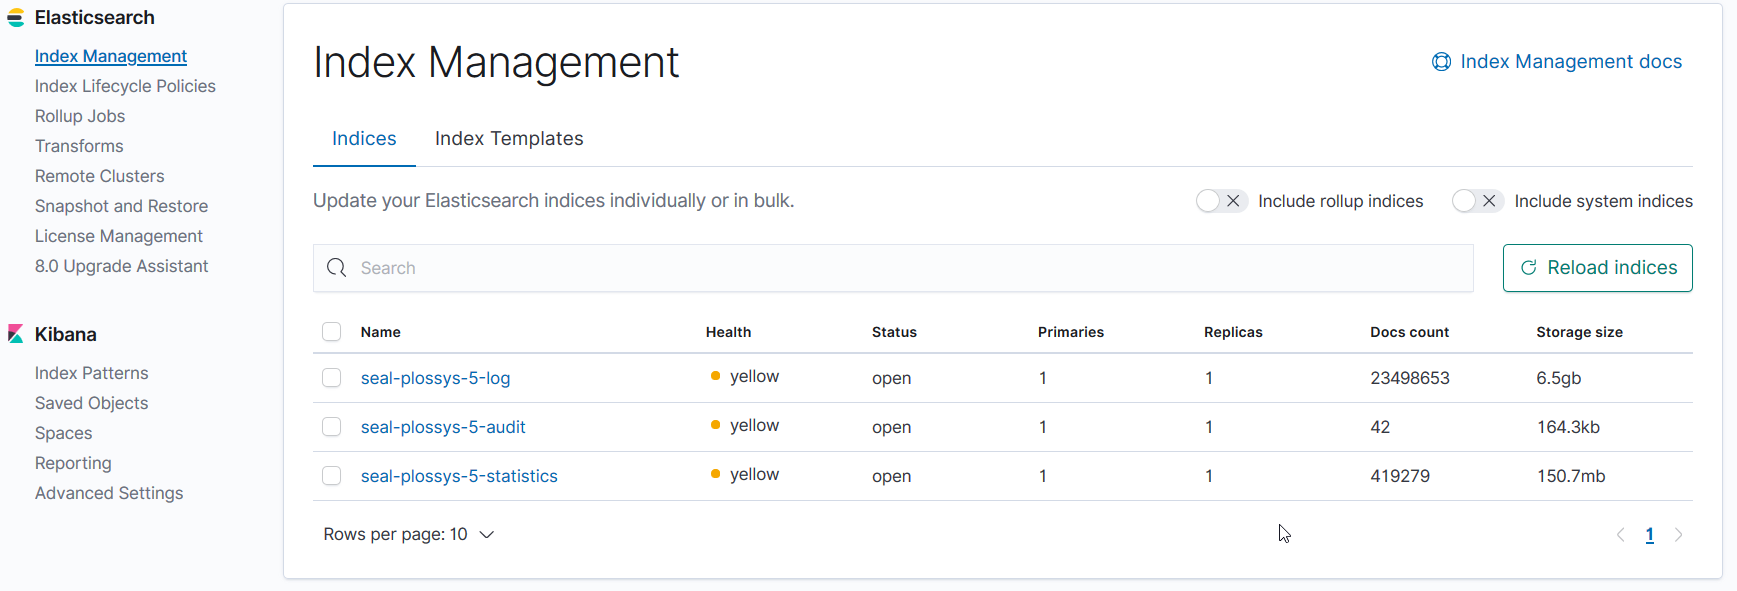
Check the list of the indices. The
Index Managementlist now contains the indices forseal-plossys-5-log,seal-plossys-5-statisticsandseal-plossys-5-auditif configured: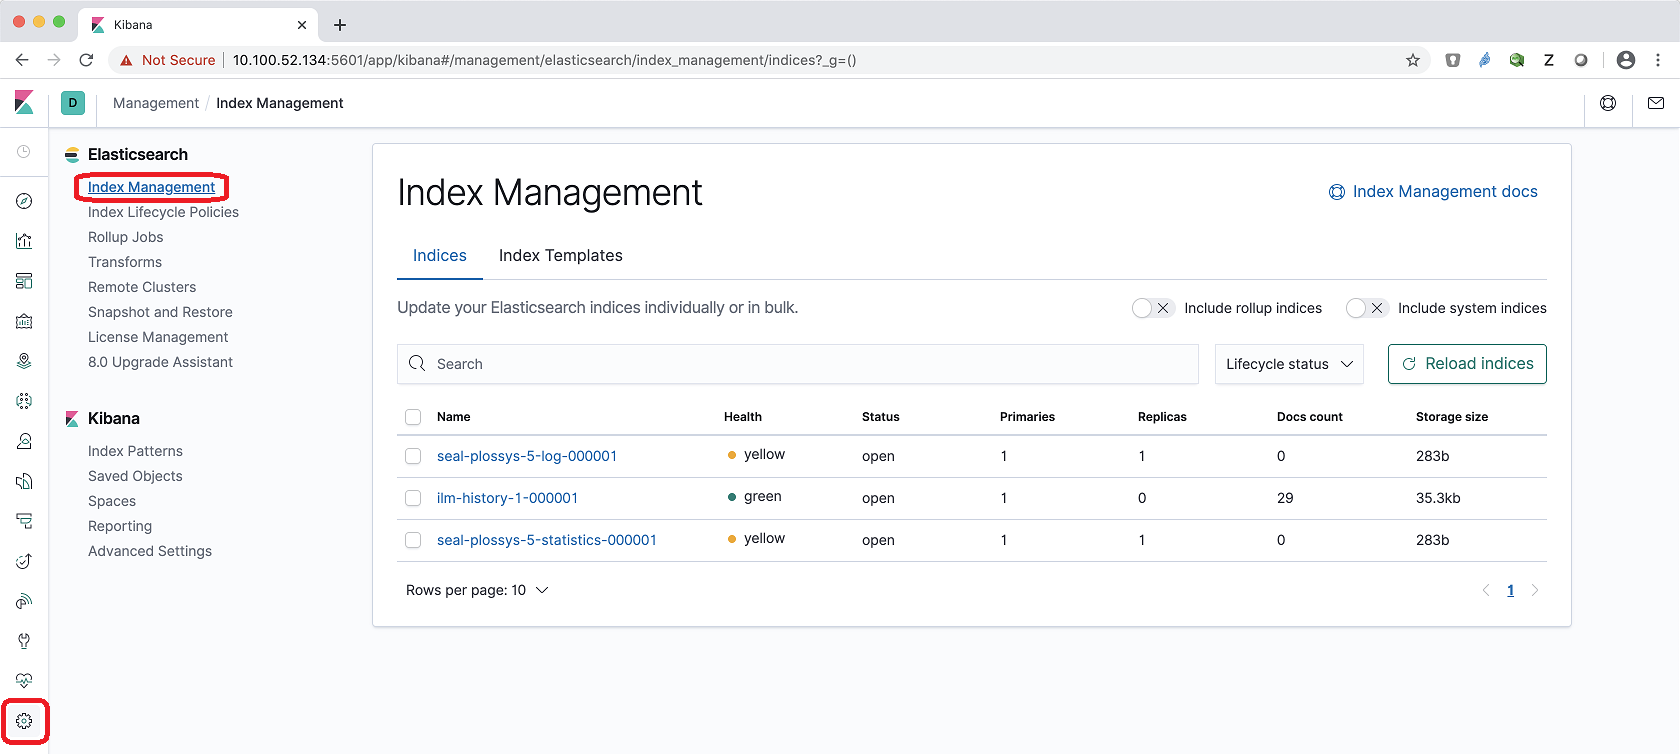
-
Start the
seal-filebeatservices on all PLOSSYS 5 servers (if already installed):plossys service start seal-filebeat
Activate the Pattern for the seal-plossys-5-audit Index
With PLOSSYS 5.3.3., audit messages have been introduced. When updating to PLOSSYS 5.3.3, you have to adjust filebeat.yml manually as described in Update on Windows or Update on Linux and restart the PLOSSYS system.
With audit messages, the following indices are listed in Elasticsearch:
For the audit messages, you have to create an index pattern:
-
Change to
Index Patternsin theKibanasection and clickCreate index pattern.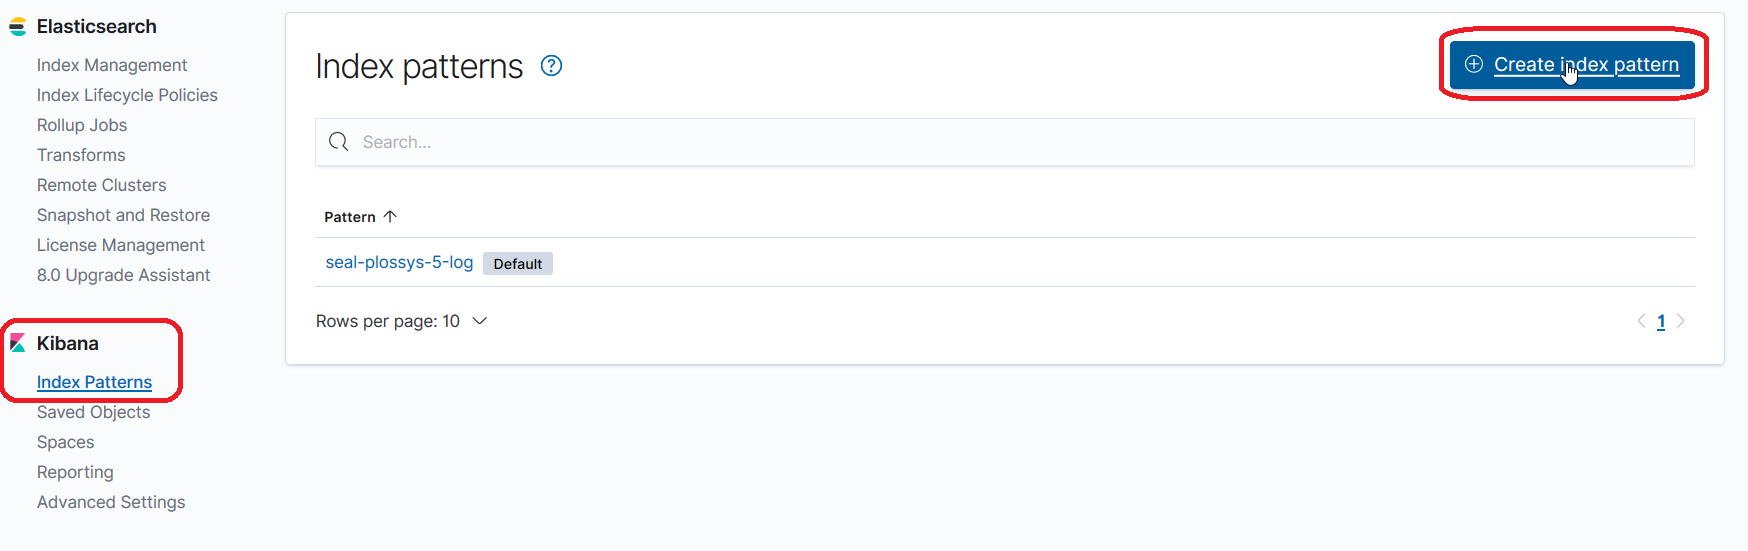
-
Select
seal-plossys-5-auditfrom the list of existent indices in the creation dialog: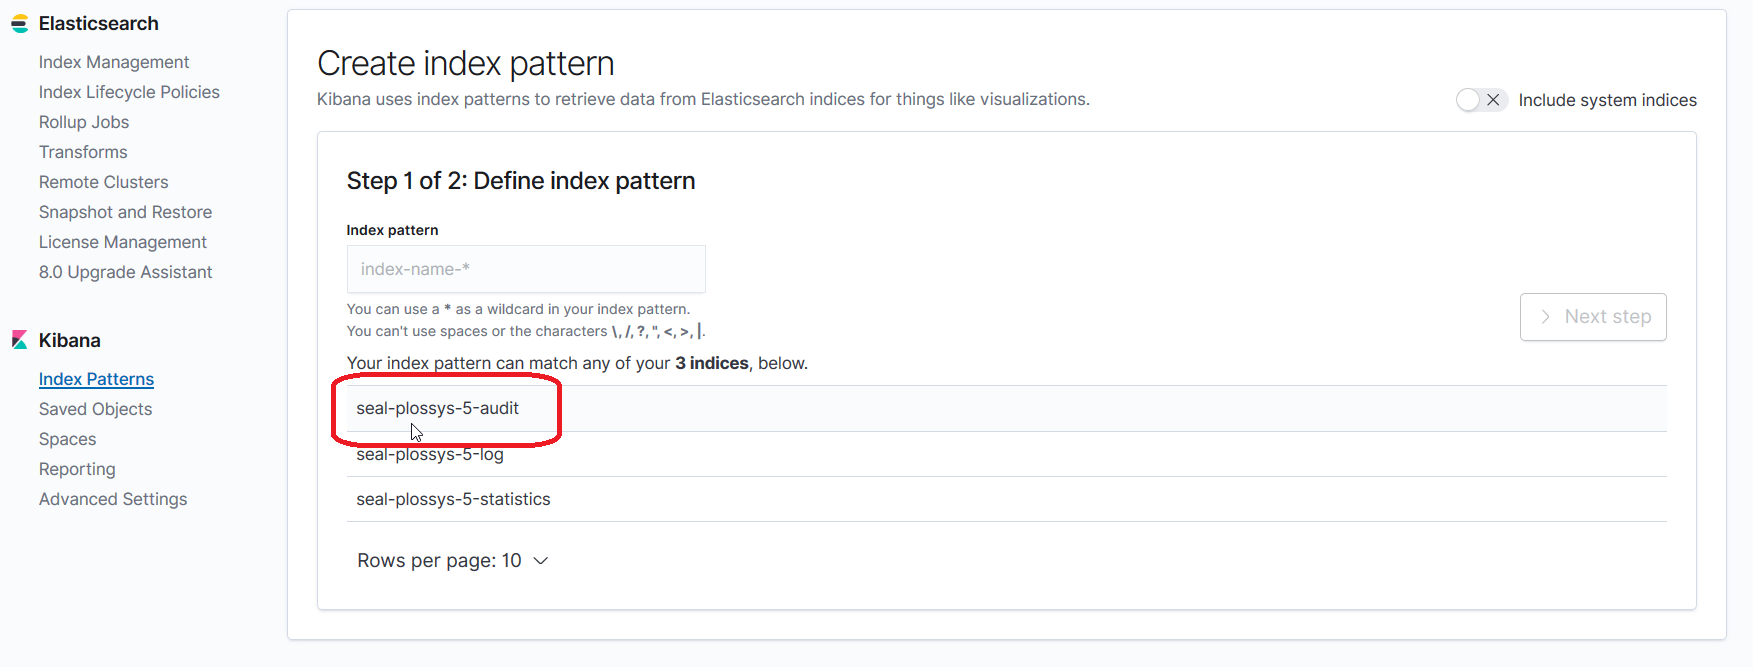
-
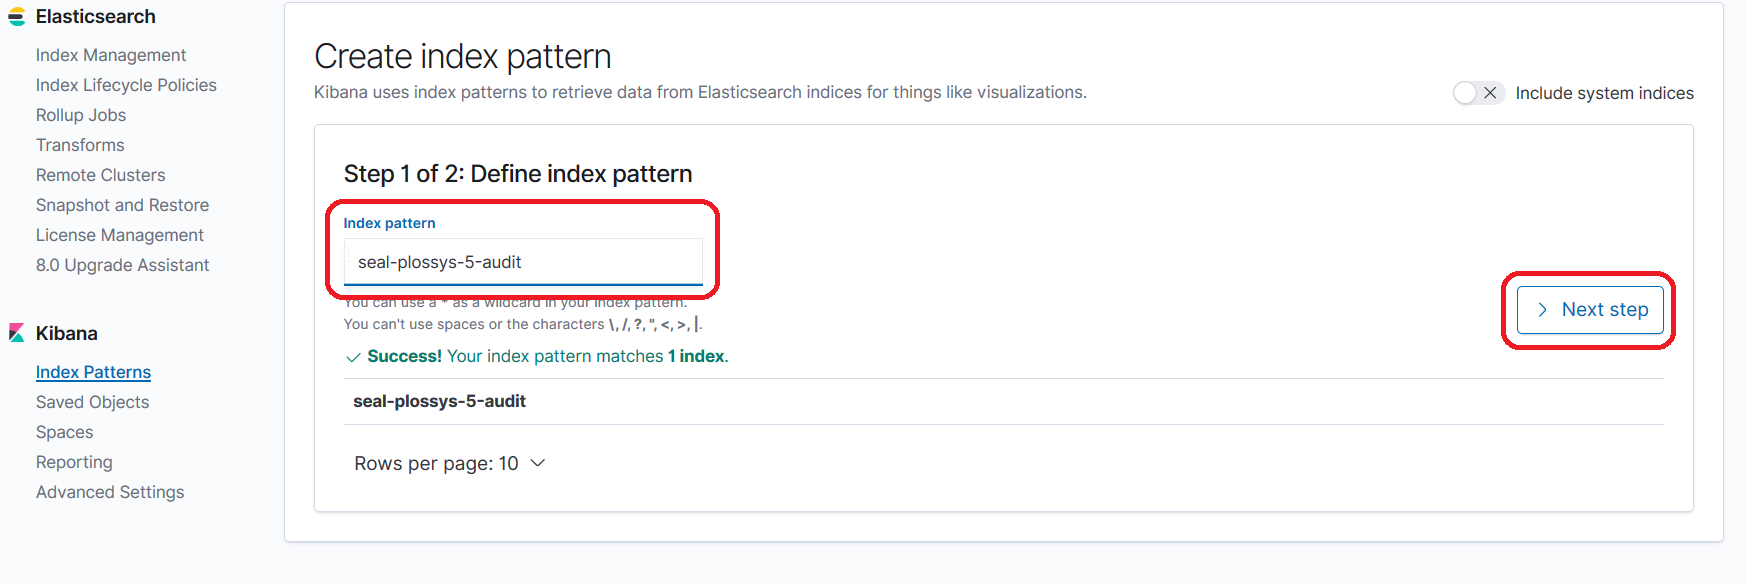
Proceed to the next step:
-
Select
@timestampfrom the list of available fields for refreshing the data and clickCreate index pattern: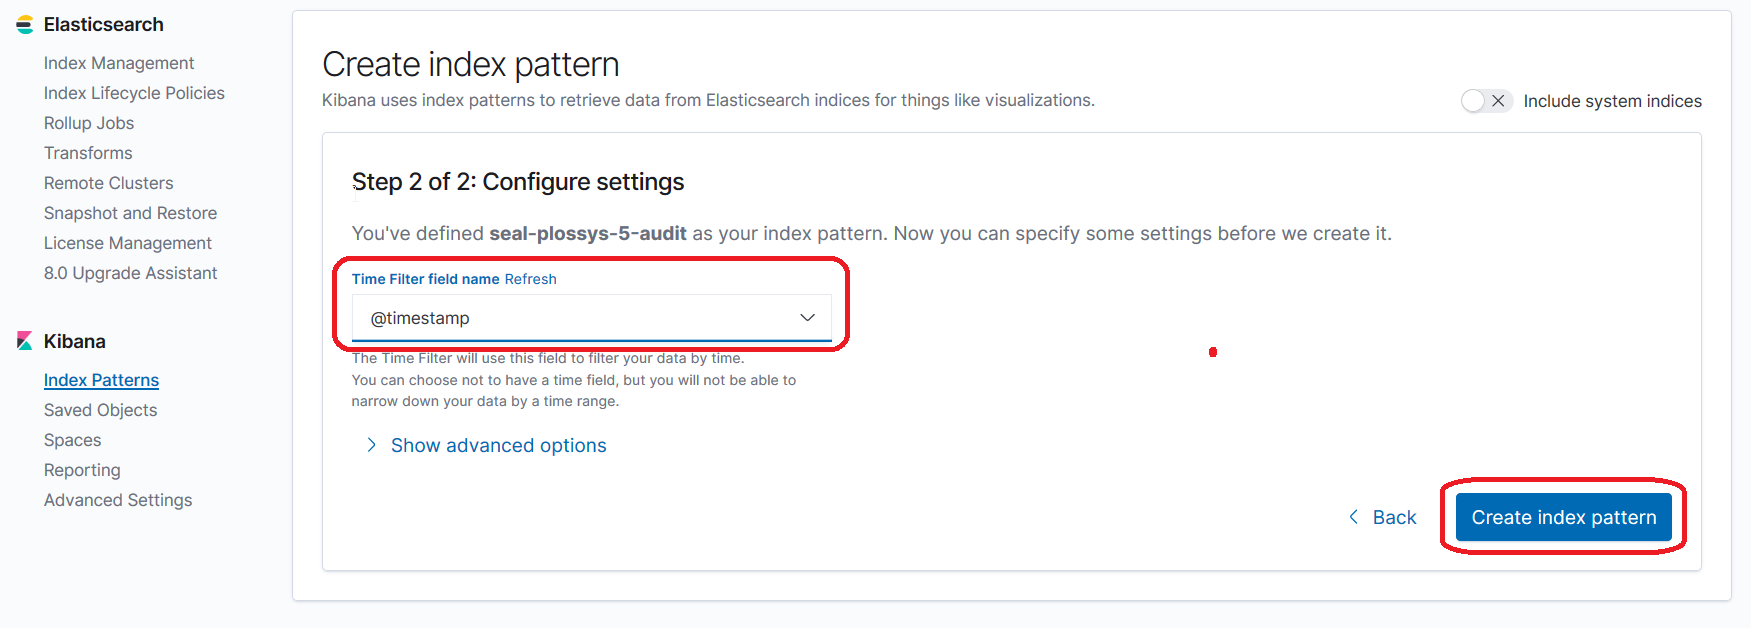
-
In the overview, you can select the
seal-plossys-5-auditindex pattern now: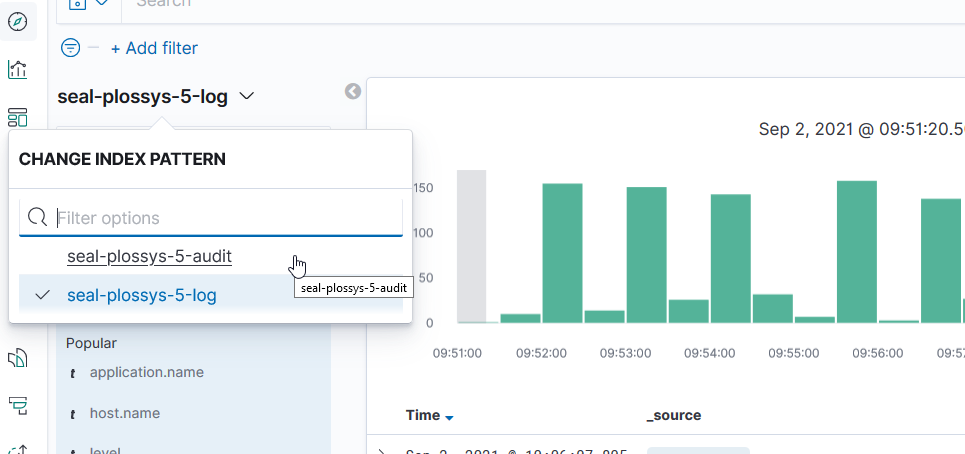
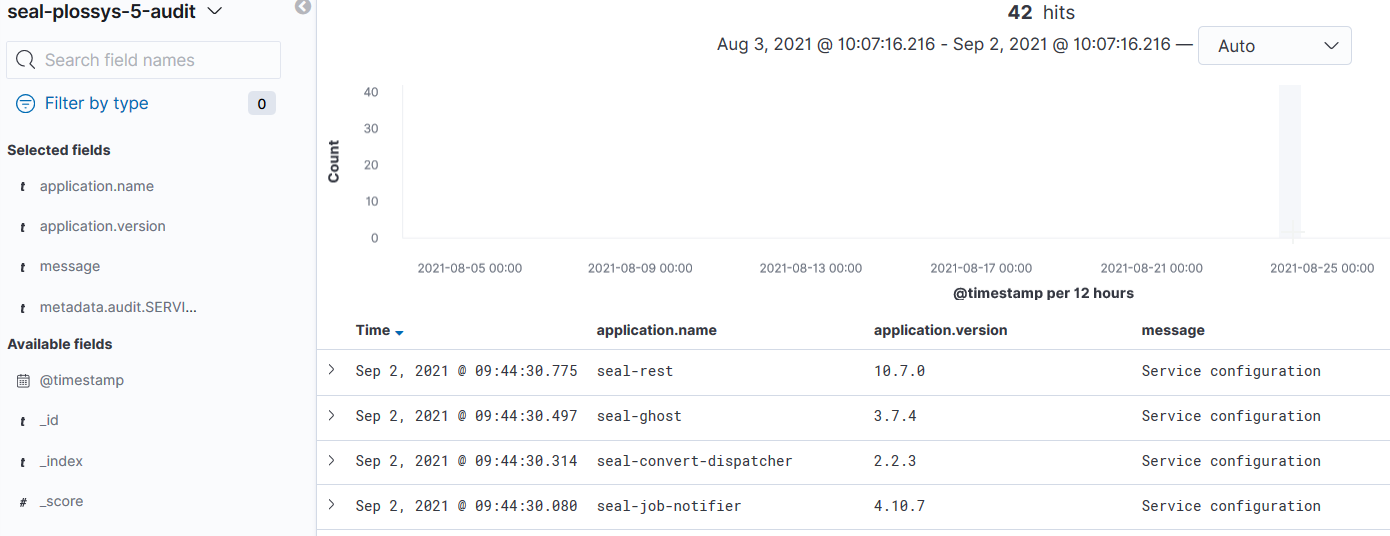
-
The audit messages are listed and you can configure the view:
Indices Used in Elasticsearch for PLOSSYS 5
The indices used in Elasticsearch for the log and statistics messages of PLOSSYS 5 are specified in the following keys in the PLOSSYS 5 system:
-
ELASTICSEARCH_INDEX_LOG: Index used for the log messages -
ELASTICSEARCH_INDEX_STATISTICS: Index used for the statistics messages